Code
library(git2r)
repository(path = ".", discover = TRUE) |>
  plot(breaks="quarter",
       main = "Nehemie's Website Repository")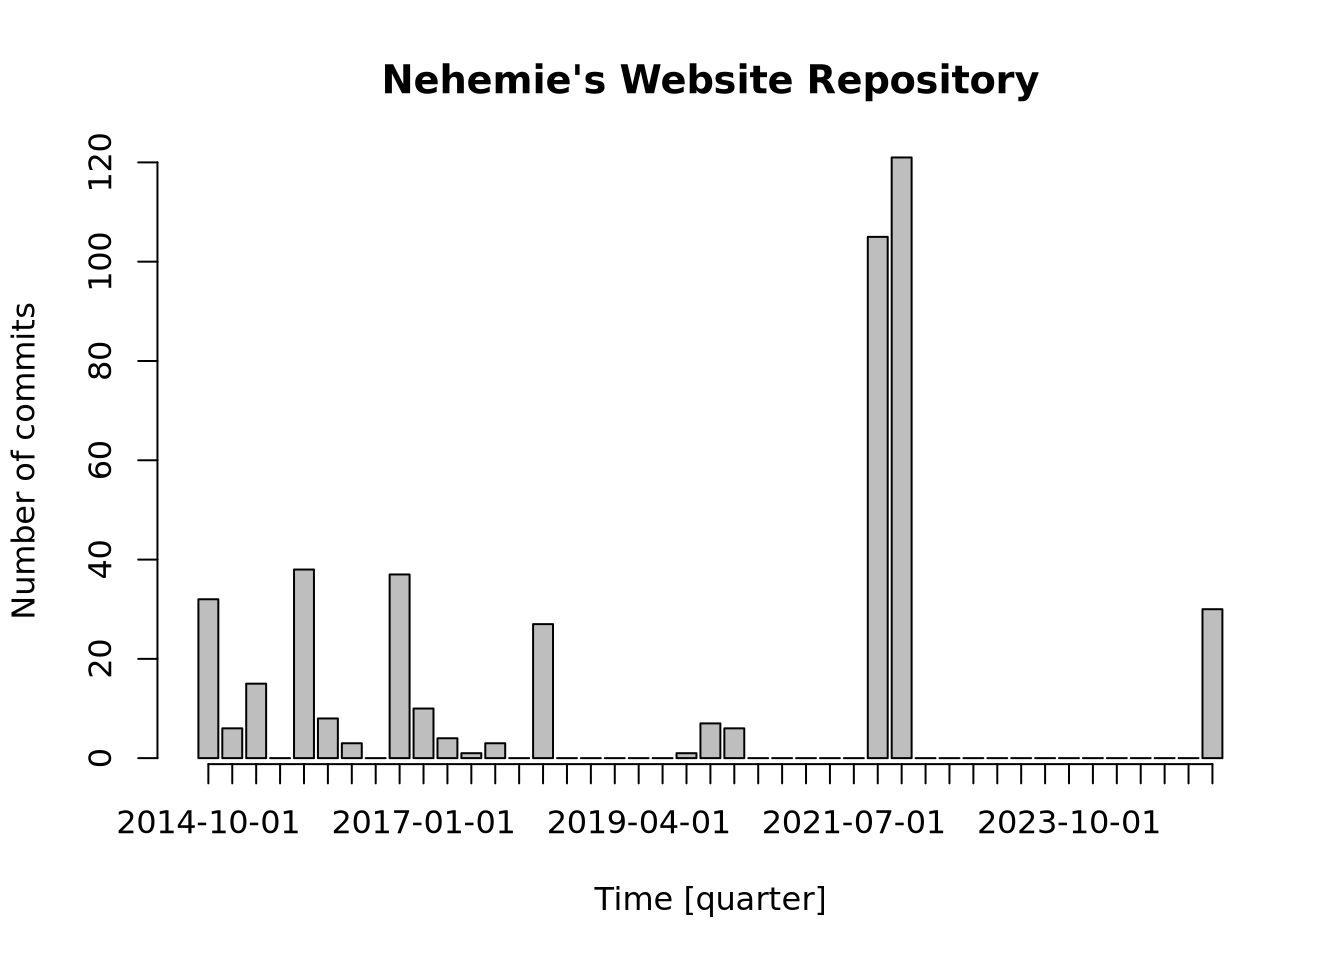
☛ This is my first post using live data. As such, I wouldn’t be surprised if it breaks. Please let me know if I should take another look here → mail me 📧.
In an article with Toby C. Wilkinson, we discuss the power of Git as a version control system (VCS) for enabling transparency through data history. A VCS is a tool that records changes to files over time, allowing users to track revisions, revert to earlier versions, and collaborate effectively. It is widely used in projects where multiple people edit files (such as Linux), because it maintains a detailed history of who changed what, when, and why.
Version control has a long history (since 1962 🅦). I wish more people used it, it helps keep filenames clean, makes changes easy to follow, improves collaboration, and prevents the infamous “final.doc” chaos.
For the archaeological Panormos Landscape Survey (2015–2019) on the Aegean coast of Turkey, we implemented a data pipeline in which we tracked file changes regularly, aiming to record different versions of our files, motivated by the Open Science movement’s call for greater transparency:
“One remarkable observation to be made about a data flow strategy for fieldwork oriented around Open Science policies and a version control platform such as Git is the parallel between the task of an archaeologist (who creates a story of the past based on searching for relations between objects/traces in the present) and the task of an Open Science reviewer or a data historian (who creates a story about a project’s past based on searching for relations between fragments of data left in the archive, cf. Germán, Adams, and Hassan 2016). The metaphorical link to a process of excavation is even recognised by Git developers: one tool is called the
pickaxe interfaceand allows users to search for specific strings across the entire Git history. Git history diagrams are effectively chronological tree diagrams not dissimilar to Harris Matrices. Archaeologists, of all data scientists, therefore should appreciate the importance of data versioning from a practical and theoretical perspective, recognising the insights to future generations that discarded fragments can provide about its producers.” (Wilkinson and Strupler 2017, 284)
This week, I seriously revamped my website after more than two years of silence. I was curious to take a look at the idea of “recognising the insights” that a history of snapshots “provide about its producers” and see what the Git repository of this website reveals about the history of its author.
The R library git2r (Widgren 2024) provides a convenient way to access many functions of the Git software and to read the data into R and there is even a plot function .
library(git2r)
repository(path = ".", discover = TRUE) |>
plot(breaks="quarter",
main = "Nehemie's Website Repository")
This is a bar plot of the “commits” over time in my repository. A Git commit is a recorded snapshot of the changes made to a set of files in a project (see What is Git?, Chacon, Straub, and contributors 2014). The plot shows the number of snapshots I have made each quarter of year since the repository was created. TL;DR: The higher the bar, the more changes I have saved.
The first thing to notice is that I am quite irregular when it comes to working on my website. There is a common pattern of working on it, a lot, then less and less, before returning to it later. I get the impression that I tend to update my website when I’m looking for a new job (and when my fixed-term contracts come to an end, every two years). I am also realizing that I have already been occupying a little corner of the World Wide Web for 10 years. A good reason to stop here and enjoy some treats 🍇🍉!