Road Length outlier

Where are you?

Berlin
Bike
2022
Open Data
Author

Néhémie Strupler

Published

March 18, 2022

Yesterday I did a quick plot about the length of roads by class. One value stands out, an outlier. In class IV one road has a length longer than 4000m. Do you know wich one?

It is one on my favorite, the Havelchaussee. Well, when I looked into the details of the data, I saw that the answer may be a bit more complicated, as the length I calculate depends on how the geometry is defined in the data set. For example, the Havelchaussee is the longest, but actually there are 5 other geometries called “Havelchaussee”. There are just defined with new geometries because they have some different properties (like being located in another district). To have a better idea of the different lengths, it would be better to group the road according to their identification numbering. So let us see what happen if we first merge the geometries for each road.

Exhibit of the day

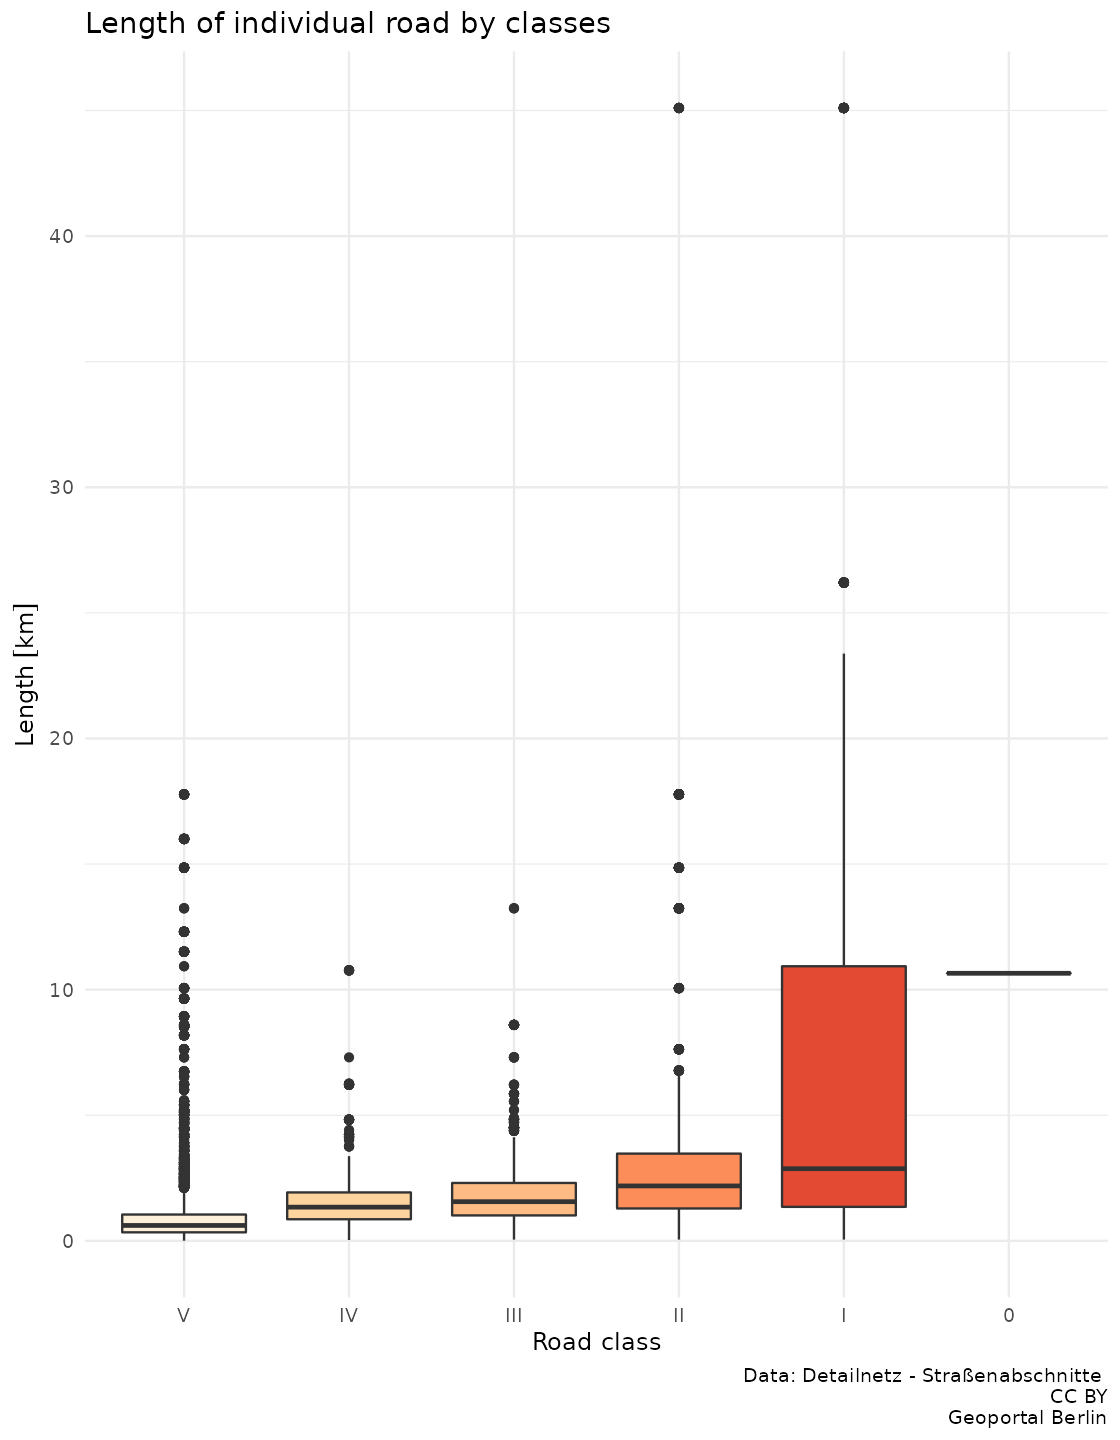
A box plot of road length according to their number

Show the code of the exhibit
library(sf)
library(dplyr)
library(ggplot2)
library(units)

# "https://fbinter.stadt-berlin.de/fb/wfs/data/senstadt/s_vms_detailnetz_spatial_gesamt"
# https://tsb-opendata.s3.eu-central-1.amazonaws.com/detailnetz_strassenabschnitte/Detailnetz-Strassenabschnitte.gml
dsn <- read_sf("raw_data/Detailnetz-Strassenabschnitte.shp")
dsn$strassenkl <- factor(dsn$strassenkl)
dsn$strassenkl <- factor(dsn$strassenkl,
                            rev(levels(dsn$strassenkl)))
dsn$length <- st_length(dsn)

dsn %>% filter(strassenna == "Havelchaussee")
dsn_data <-  dsn
st_geometry(dsn_data) <- NULL
dsn_data  %>%
  group_by(strassensc) %>%
  mutate(laenge = sum(laenge)) -> dsn_sl


dsn_sl %>%
#  filter(length < set_units(5000, m)) %>%
  ggplot() +
  geom_boxplot(aes(x = laenge, y = strassenkl, fill=strassenkl)) +
  scale_fill_brewer(palette="OrRd",
                    limits = rev(levels(dsn$strassenkl)),
                    direction = -1) +
  theme_minimal() +
  coord_flip() +
  theme(legend.position="bottom") +
  labs(colour = "Road class") +
  labs(title = "Length of road number by classes",
       caption = "Data: Detailnetz - Straßenabschnitte \nCC BY
       Geoportal Berlin")

ggsave("2022-03-18_road_number_length.jpg",
       width=7.0,
       height=9,
       bg="white",
       dpi = 160)

Boxplot length road. Data: CC BY “Geoportal Berlin / Detailnetz Straßenabschnitte”. Plot made with R and ggplot2 (code in the source page as comments)