The open data offered by the municipality of Berlin (see https://daten.berlin.de/) include since 2018 the data of traffic accident in Berlin-Brandenburg. Even if the data are older that the 2021’s LOR division (see yesterday’s post), forward compatibility is available. How uneven are bike accident according to the spatial/social division?
Exhibit of the day
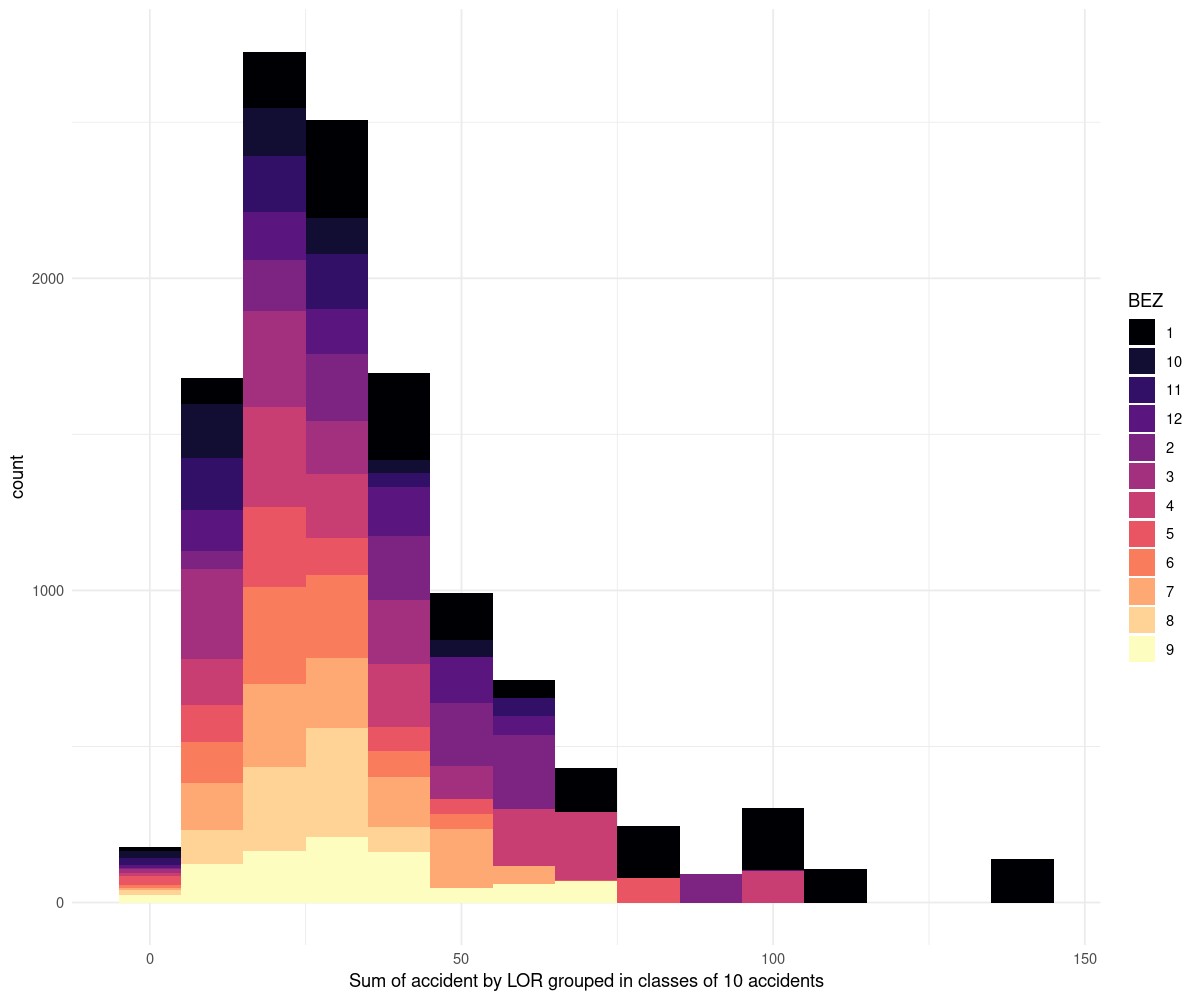
It is a count of LOR units by number of accident in class of 10. Most of the LOR geographical units reported between 10 and 20 accidents in 2020. The colour indicates the Bezirk; the black colour (1) − Mitte − has the highest number of traffic accidents.
Show the code of the exhibit
library(sf)library(dplyr)library(ggplot2)crash <-read.csv2("raw_data/AfSBBB_BE_LOR_Strasse_Strassenverkehrsunfaelle_2020_Datensatz.csv",colClasses =c(rep("character", 1),rep("factor", 12),rep("integer", 6),rep("factor", 1),rep("numeric", 4)))crash[14:19] <-apply( crash[14:19], 2, as.logical)crash |>group_by(LOR_ab_2021, BEZ) |>summarise(count =n()) -> crash_loredjpeg("2022-03-04_lor_crashed.jpg",width=1200, height=1000, quality=90,res=120)ggplot(crash_lored, aes(count)) +geom_histogram(aes(fill=BEZ), position="stack", binwidth=10)+scale_fill_viridis_d(option ="A") +theme_minimal()+xlab("Number of accidents by classes of 10 accidents")+ylab("Number of LOR")dev.off()
Berlin’s LOR. Data: Strassenverkehrsunfälle nach Unfallort in Berlin 2020 , CC-BY-3.0 Amt für Statistik Berlin-Brandenburg
Plot made with r and ggplot2 of showing the accident in 2020 (data here).