I finished yesterday’s post in stating that I did not understand which situation the class of accident “0” and “1” covered. In the database, you have another classification of accident and I am struggling to understand it too. The Destatis’ booklet explains that “accident type” (Unfalltyp) describes the conflict situation that led to the accident and in contrast to the class of accident (Unfallart), it is not about the description of the actual collision, but about the kind of conflict that triggered the collision. They are 7 main types:
Driving accident: loss of control of the vehicle.
Turn accident: triggered by a conflict between a person turning and a road user
Turning/crossing accident: The accident was triggered by a conflict between a person who is required to wait and a vehicle that has the right of way at intersections, junctions or exits from properties and parking lots.
Pass-accident The accident was caused by a collision between a vehicle and a pedestrian
Accident caused by stationary traffic: accident between a vehicle in moving traffic and a vehicle that is parking/stopping
Accident in parallel traffic: road users who were moving in the same or opposite directions
Other accident: other class (reversing, obstacles or animals on the road, sudden vehicle damage (brake failure, tire damage, etc.).
Picture of the day
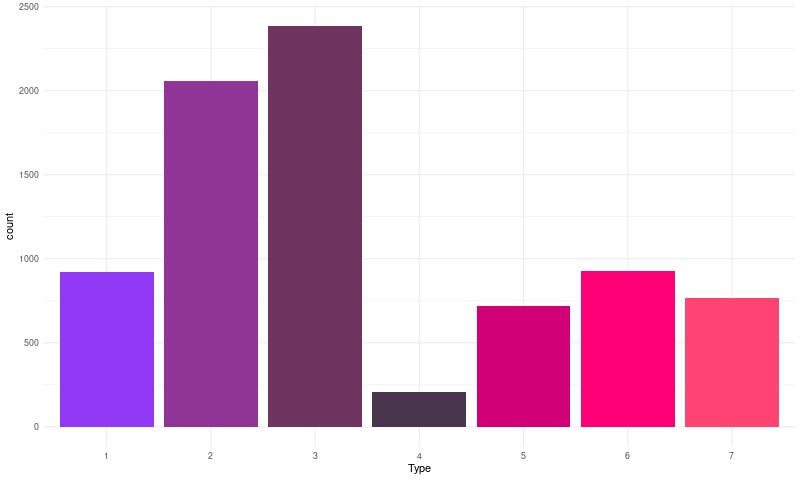
This is a graph of the type of accidents (unfalltyp) involving a bike in Berlin and Brandenburg.
Number of bike accident by type. Exhibit made with R (code provided in a comment of this webpage) Data Copyright: DL-DE BY 2.0 Statistische Ämter des Bundes und der Länder, Deutschland, 2021.
It is still not clear to me, how to understand it!