This week, I was looking into the open data offered by the municipality of Berlin (see https://daten.berlin.de/). When I was scrolling through the entries, one data set caught my attention. It is a classification of Berlin’s neighborhood according to the age of the building (available in the GML format here). It picked my curiosity because it was a dream to obtain a similar classification for my PhD. I also dated houses from a capital city, but is was Hattuša and housed constructed and destroyed between 1800 and 1200 BCE. The main difference is my classification was done with interval classes of 100 years instead of 10 years!
Picture of the day
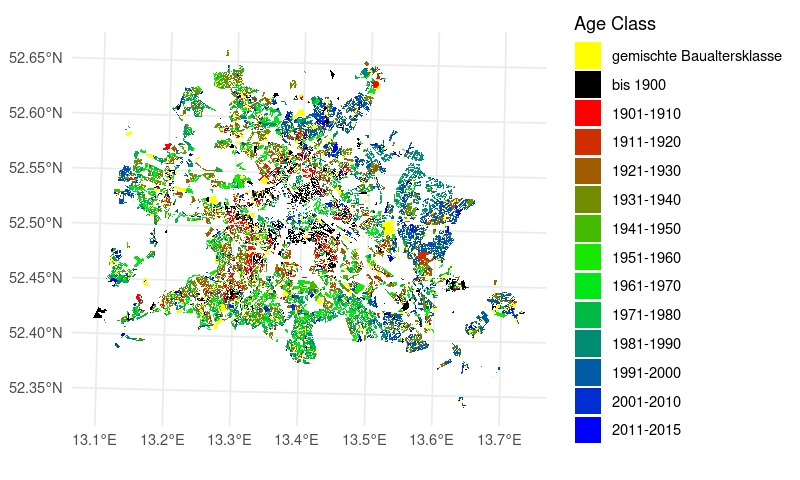
A quick map of Berlin’s neighborhood coloured according to the age of the buildings. The map was done with r, sf and ggplot2 (the R code is available as comment in the source code of this page).
I do not know enough of Berlin to be able to analyse the distribution. My guess is that part of Berlin’s history can be seen. For example, buildings with a construction date later than 1990 are mainly located in the east,